March 3, 2025
Fredman’s carbon footprint for 2024 is 21,548.57 CO2e, equivalent to the annual emissions of approximately 2,200 average Finns*. Relative to revenue, Fredman’s carbon footprint is 704.43 CO2e/M€. The total carbon footprint decreased by 14% compared to 2022 (25,018.99 t CO2e). The reduction is mainly due to fewer raw material purchases.
The comprehensive emission calculation considered both the emissions from product manufacturing at the Rauma factory (scope 1 and scope 2) and the entire value chain emissions, such as raw materials and transportation (scope 3). The calculation was particularly refined for transportation and waste emissions.
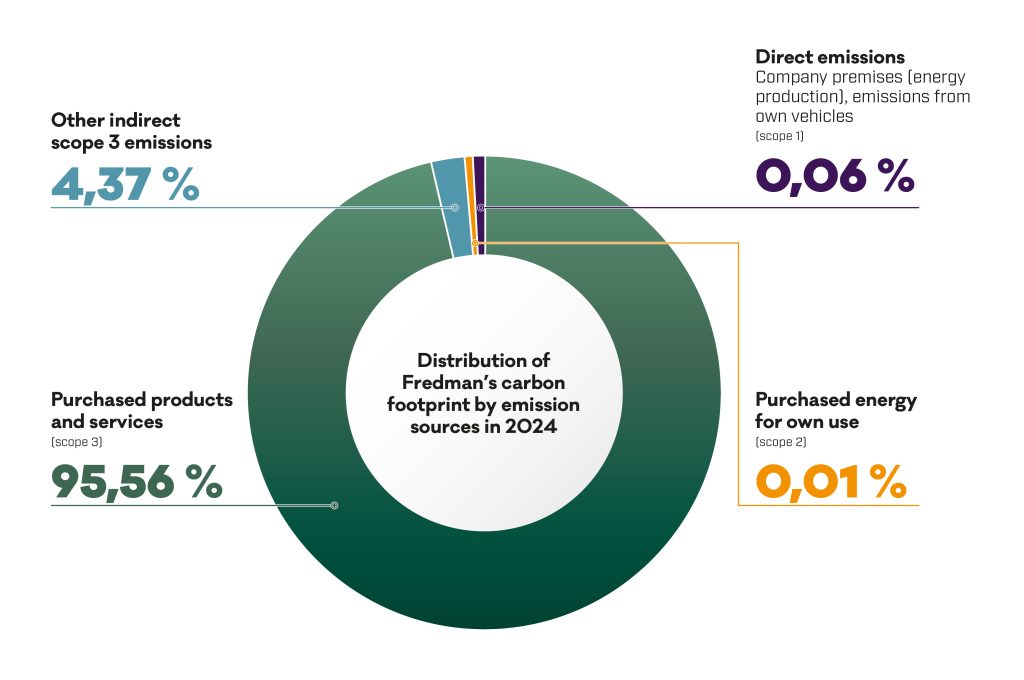
99.93% of Fredman’s emissions are caused by indirect value chain emissions – especially from purchased products and services, transportation, and the disposal of sold products. The largest emissions came from raw material procurement, with aluminum being the single largest contributor.
Already, the raw material for our filter bags utilizes cutting waste from bag production, reducing the need for virgin wood fiber. We are exploring a similar raw material for foil, made entirely from production side streams (PIR), which would significantly reduce emissions from aluminum, says Fredman’s Quality and Sustainability Manager, Kaarina Kiema.
Fredman’s operational emissions, including direct emissions and purchased energy emissions, were small, totaling 14.54 CO2e. Scope 1 and 2 emissions decreased by 6% compared to the 2022 baseline (15.48 t CO2e). The most significant factor was the move to more energy-efficient premises for Fredman’s Espoo office. Fredman’s scope 1 and 2 emissions represent 0.07% of total emissions.
The international Science Based Targets initiative (SBTi) has approved Fredman’s short-term emission reduction targets. Fredman is committed to:
Energy efficiency measures continue to play a key role in reducing our operational emissions. The largest and most challenging task is scope 3 emissions. We will continue this work determinedly with our suppliers, partners, and customers, says Kiema.
The carbon footprint calculation was done according to the Greenhouse Gas Protocol standards and guidelines. The calculation was done in collaboration with Ilmastoapu Oy.
*The average carbon footprint of a Finn in 2023 is 9610 carbon dioxide equivalents (Sitra).